How Can We Help?

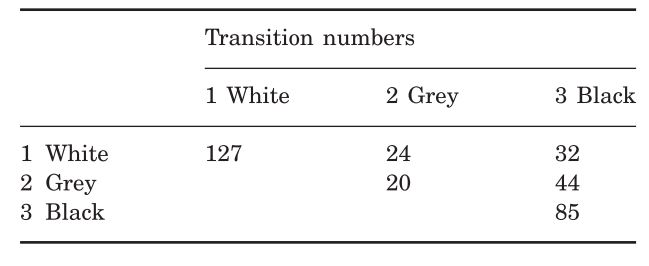
The Adjacency Analysis (Endler 2012) is an analytical framework designed to capture colour pattern geometry. It is based on the concept of running horizontal and vertical sampling transects over a segmented image (Fig. 1) where the transitions from one pixel to the next are recorded. This results in a transition matrix (Fig. 2) which can then be used to calculate a vast array of pattern parameters.

Detailed equations and a complete list of pattern parameters can be found in the suppl. material and the MICA manual. The parameter list is by far not exhaustive (Despite being significantly expanded beyond parameters discussed in Endler 2012) and we are happy to discuss new additions to the list.
Adjacency Analysis
